Interface Tour
This page explains the current Ultralyzer interface as it appears in the desktop application. The descriptions below match the labels defined in the live GUI, so they should line up with what you see in the window.
Window structure
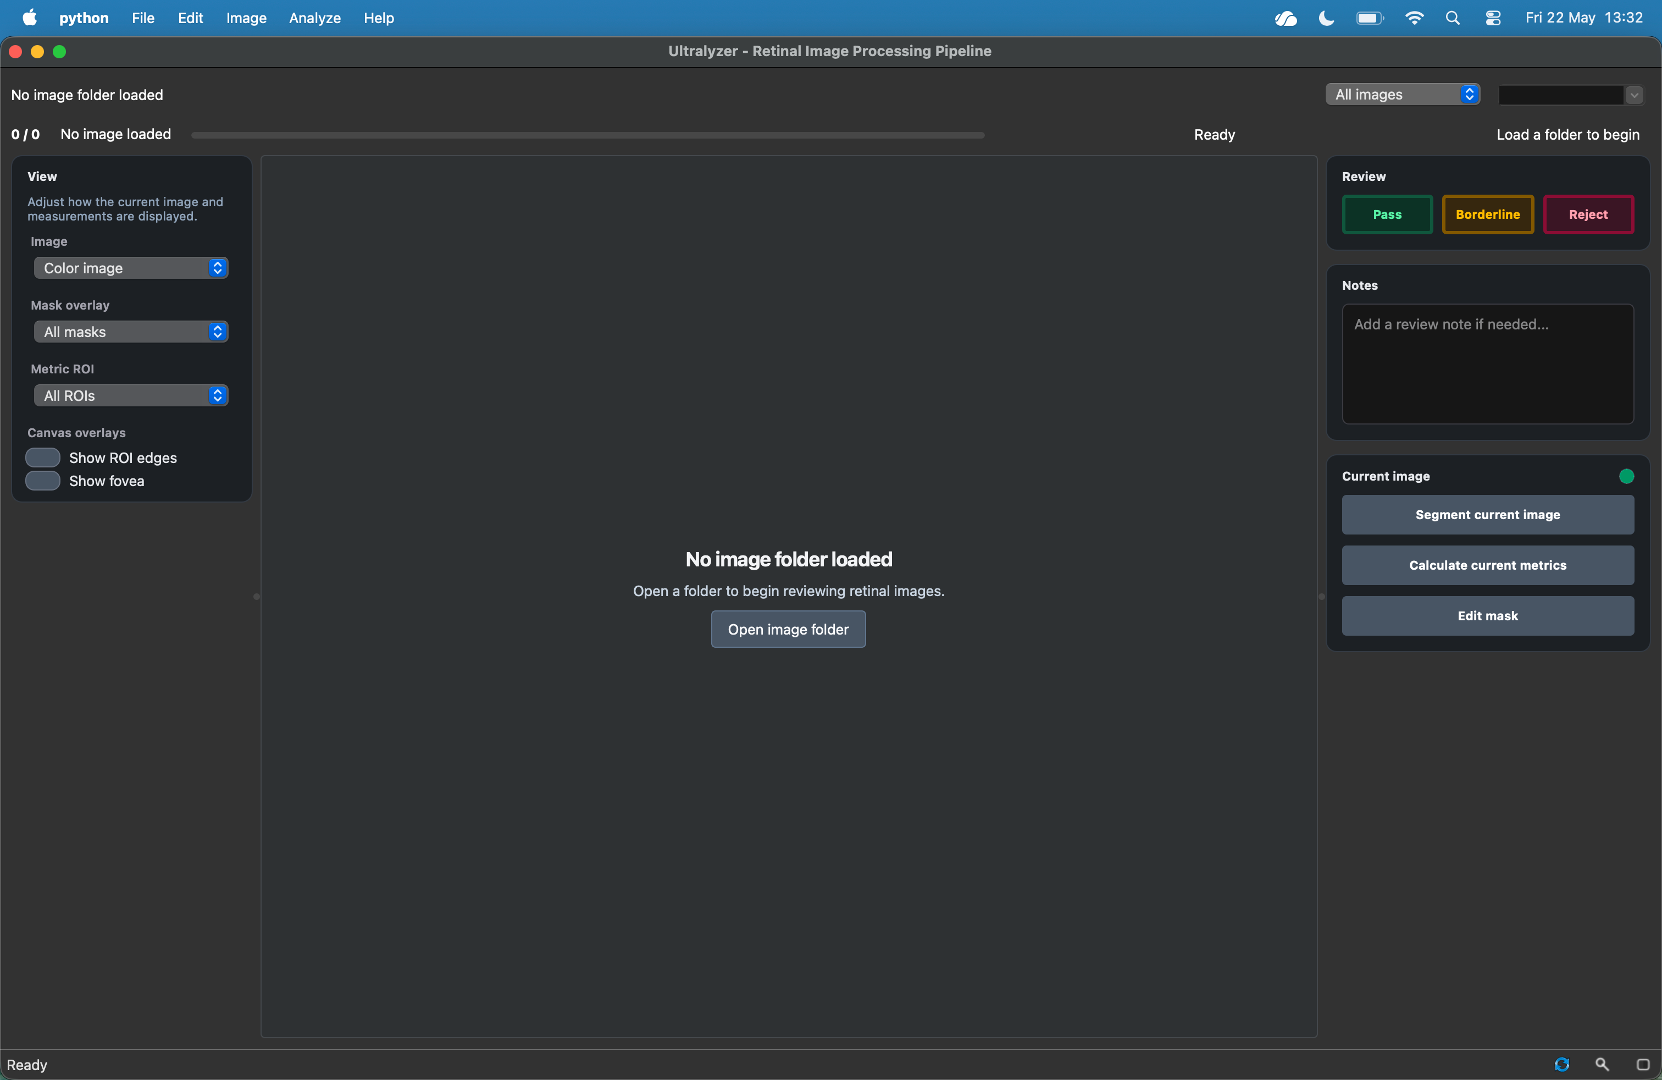
The main window is organized into five areas:
A top navigation row for dataset context and quick image selection.
A menu bar for global actions such as import, export, batch processing, and help.
A left view sidebar for image, mask, and ROI display controls.
A central canvas for image inspection and mask editing.
A right workflow sidebar that switches between review mode and edit mode.
At the very bottom, the status bar also includes compact utility controls for refresh, zoom, and mask opacity.
Central canvas
The canvas is the main inspection and editing area.
The retinal image is shown in the selected image view.
Segmentation masks are overlaid in color on top of the image.
Zoom and pan are supported.
In edit mode, the canvas responds to painting, erasing, vessel reclassification, and fovea placement tools.
The standard segmentation colors are:
Arteries in red
Optic disc in green
Veins in blue
Status bar utilities
The status bar is not only for text messages. It also includes three compact controls:
Refresh button to reload the current image and mask
Zoom button with
Fit,100%, andCenteroptionsOpacity popover with a slider for mask transparency
These controls mirror common display tasks without forcing you back into the menu bar.
Practical reading of the interface
If you are learning the GUI for the first time, use this order:
Load a folder and inspect the top navigation row.
Use the left sidebar to change channels, overlays, and ROI display.
Use the right sidebar to review or edit the current image.
Use the status bar when you need quick display adjustments.
Use the menu bar for import, export, advanced segmentation, and batch actions.